Estimates show that geographic disparities in childhood diarrhea persist, but progress has been made through reductions in key risk factors
|
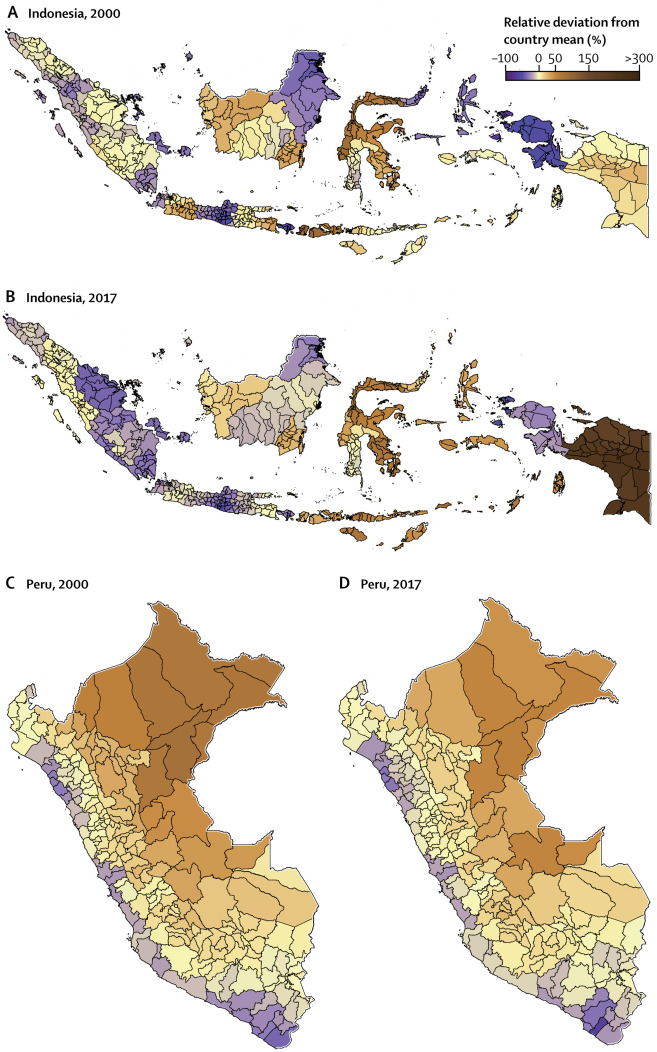
New IHME estimate show that countries such as Indonesia and Peru, pictured above, still experience substantial geographic disparities in diarrhea mortality. Source: IHME.
Diarrhea is the second leading infectious child killer in low- and middle-income countries, resulting in the loss of half a million lives each year. The World Health Organization’s Global Action Plan for Pneumonia and Diarrhea aims to end preventable diarrhea deaths by 2025 through scaling up interventions that protect, prevent, and treat this disease.
Unfortunately, resources for meeting these goals are limited, so it is critical to identify the populations that are most vulnerable and most in need of targeted interventions.
Recent work from our group at the Institute for Health Metrics and Evaluation provides the first estimates of geographic inequalities in childhood diarrhea incidence, prevalence, and mortality across low- and middle-income countries. Visitors can explore patterns during the years 2000-2017 using our publicly available visualization tools. These estimates break down into smaller geographic units in each country, such as states, regions, municipalities, and districts. We’ll just call them “subnational areas” here.
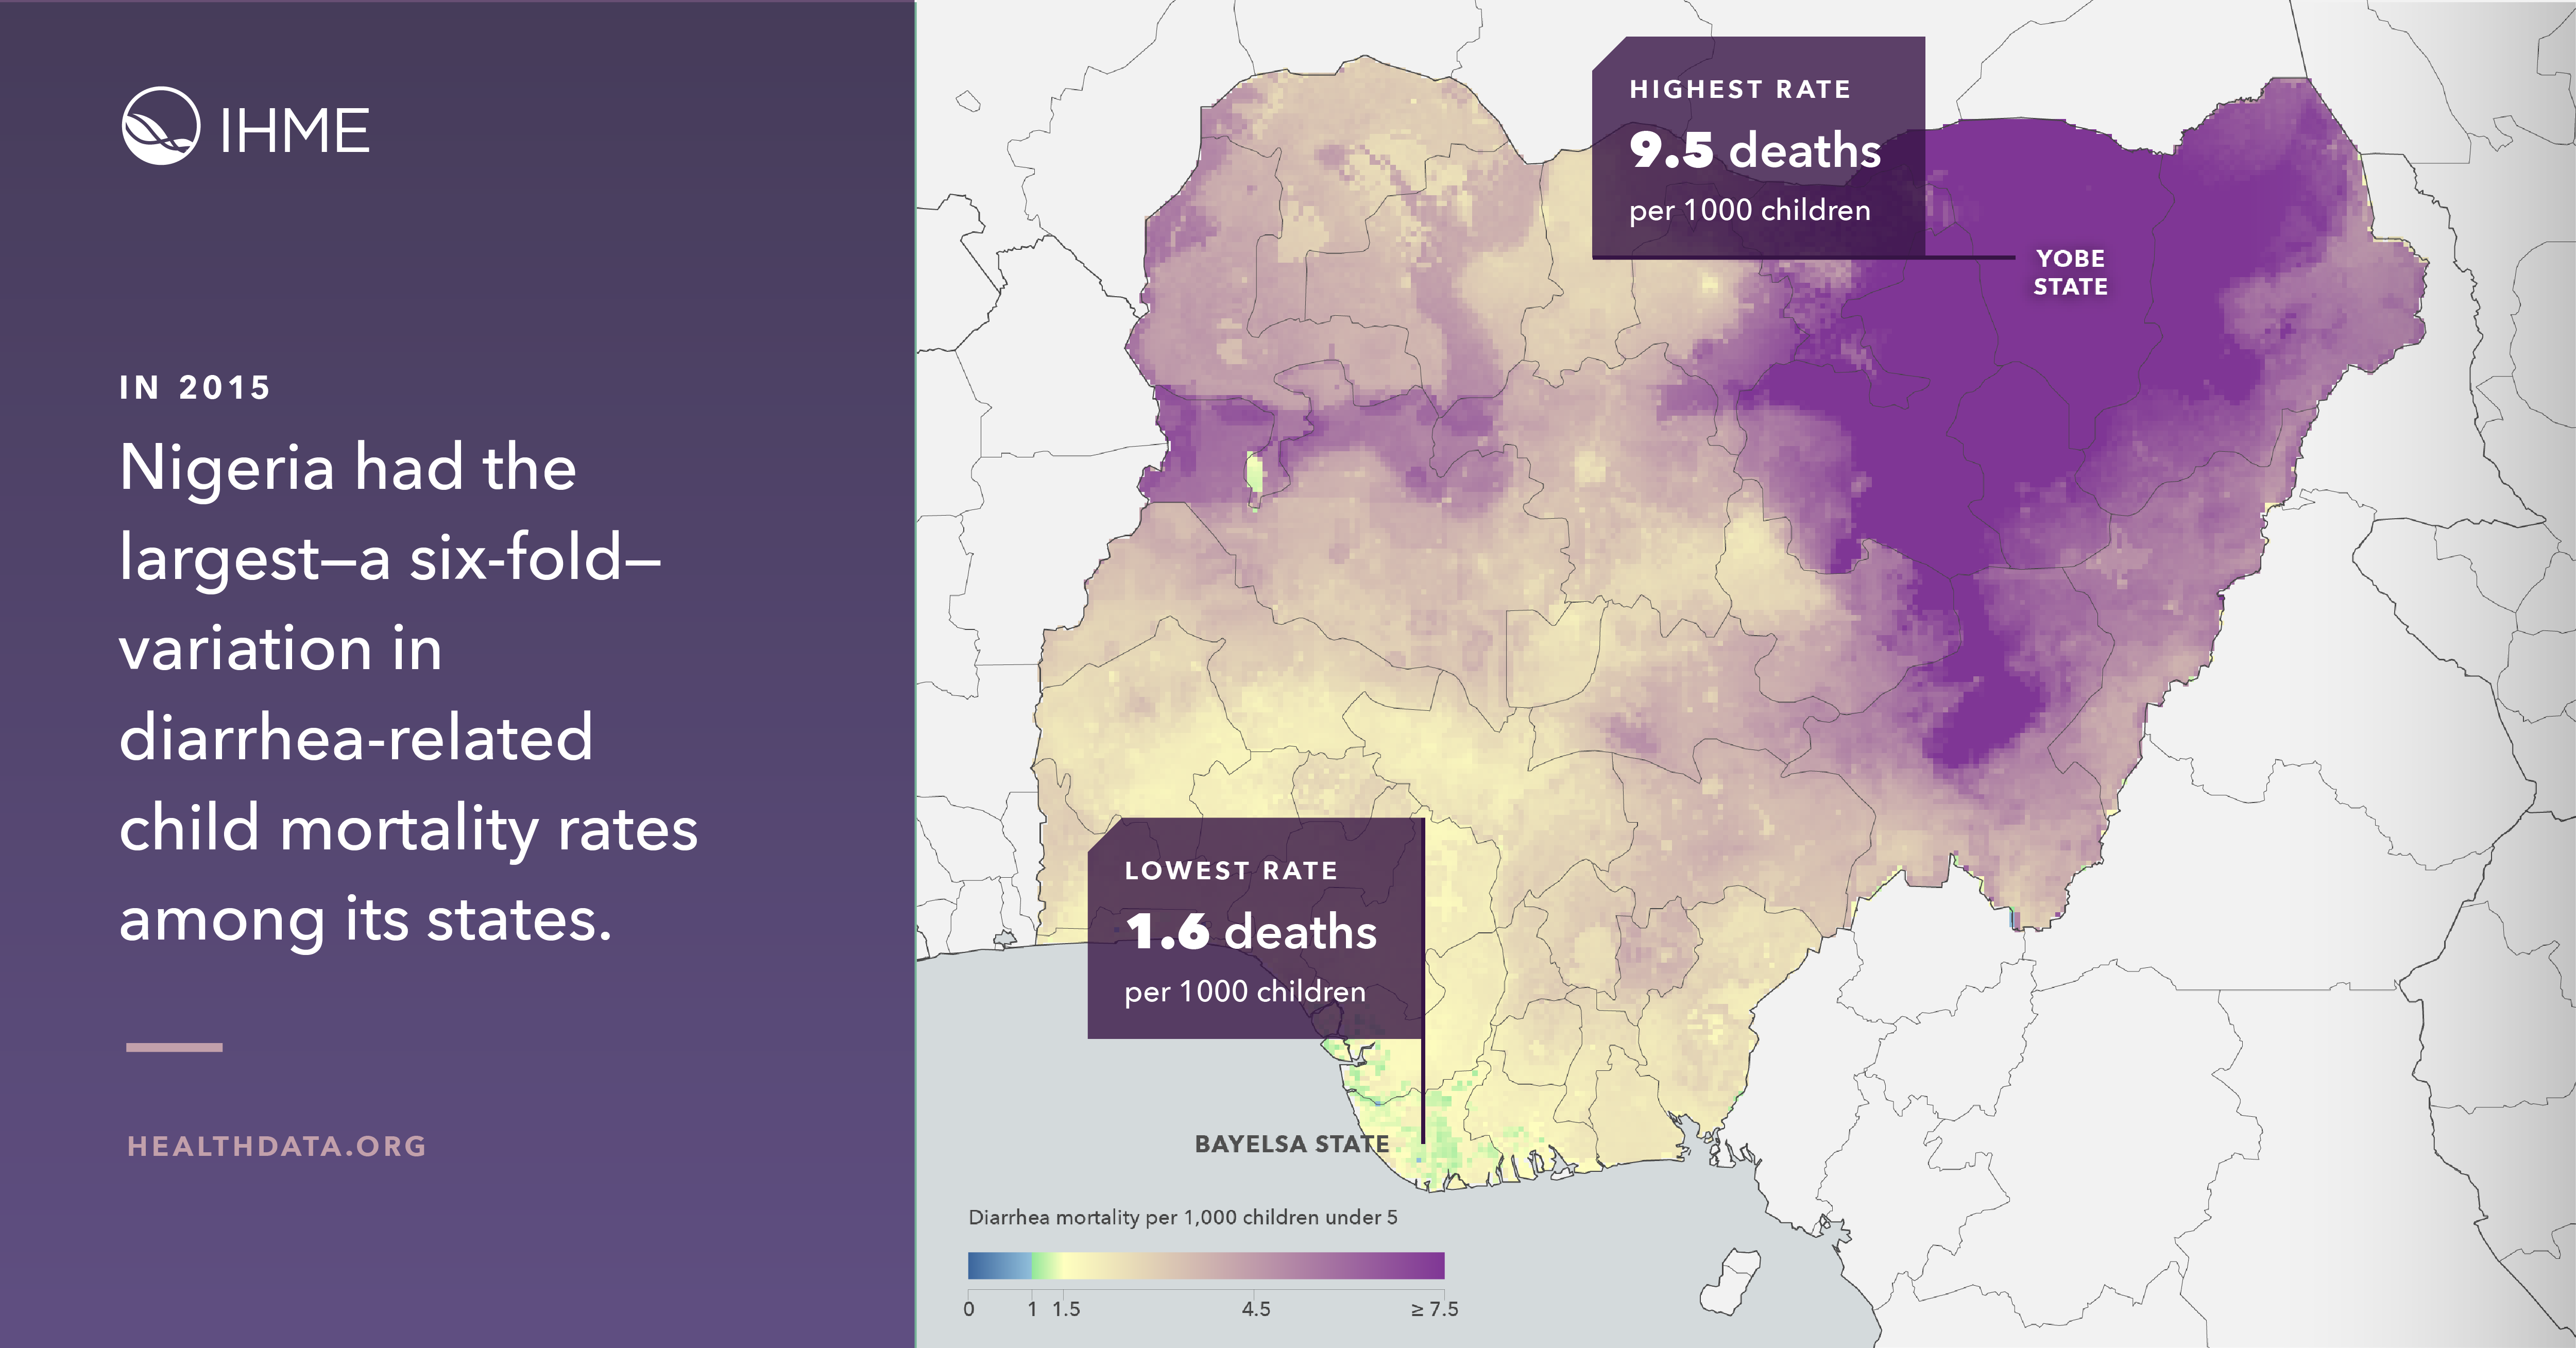
The maps below show that diarrhea mortality rates remain high in many areas, particularly within sub-Saharan African countries such as Central African Republic, Chad, Niger, Nigeria, South Sudan, and Madagascar. While rates outside of sub-Saharan Africa are lower, countries such as Mexico, Indonesia, and Peru still experience substantial geographic disparities in diarrhea mortality.
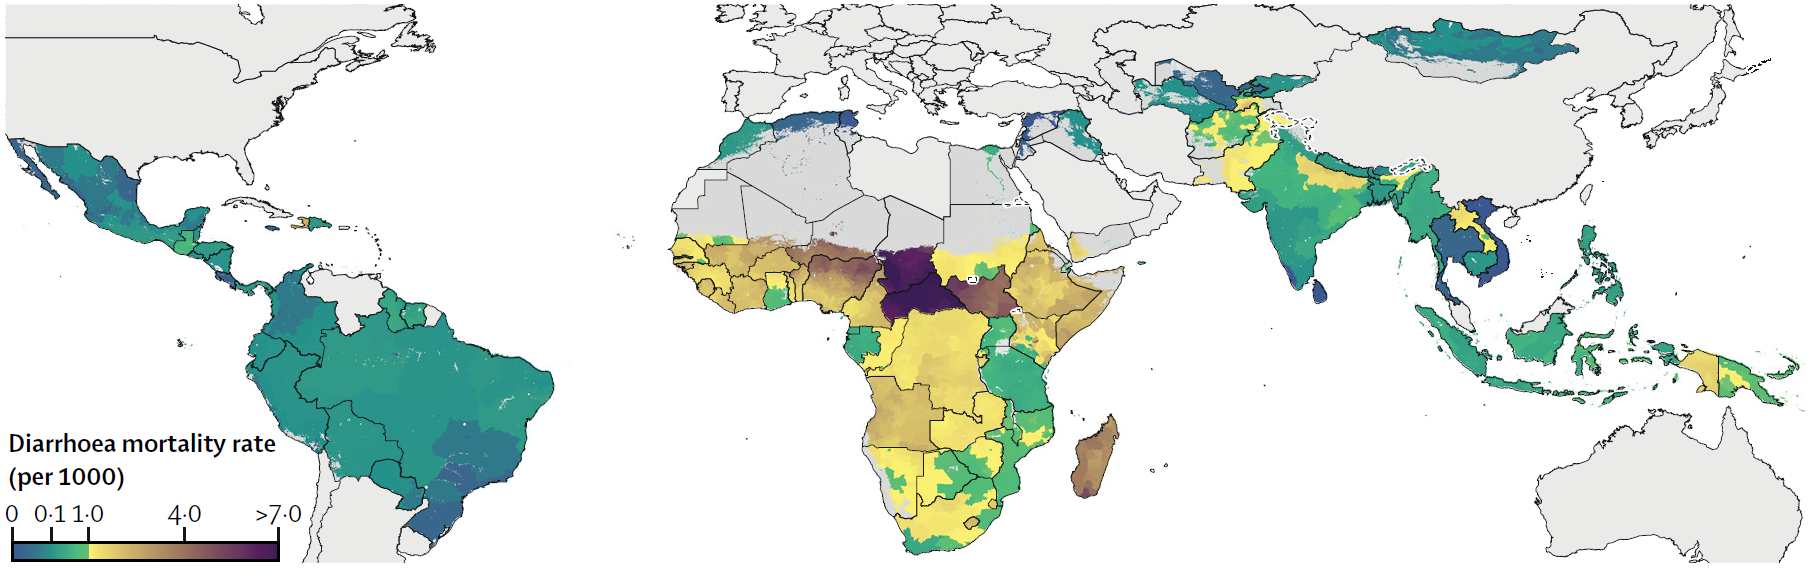
Our study also shows progress. Diarrhea mortality has been reduced in almost all subnational areas, with increases in only 0.5% of subnational areas (all within sub-Saharan Africa). The largest reductions were seen in Southeast Asia and South America.
What has contributed to the reductions? We asked this question for all subnational areas using a similar analysis to previous work, focusing on two key risk factors in the main analysis. The first risk factor was child growth failure (or CGF), which is a component of malnutrition and means a child has not reached a healthy weight or height for their age. It reduces the ability of the child’s immune response to tackle a diarrheal infection. The second risk factor was access to improved water and sanitation (or WASH), which is important for preventing diarrhea transmission.
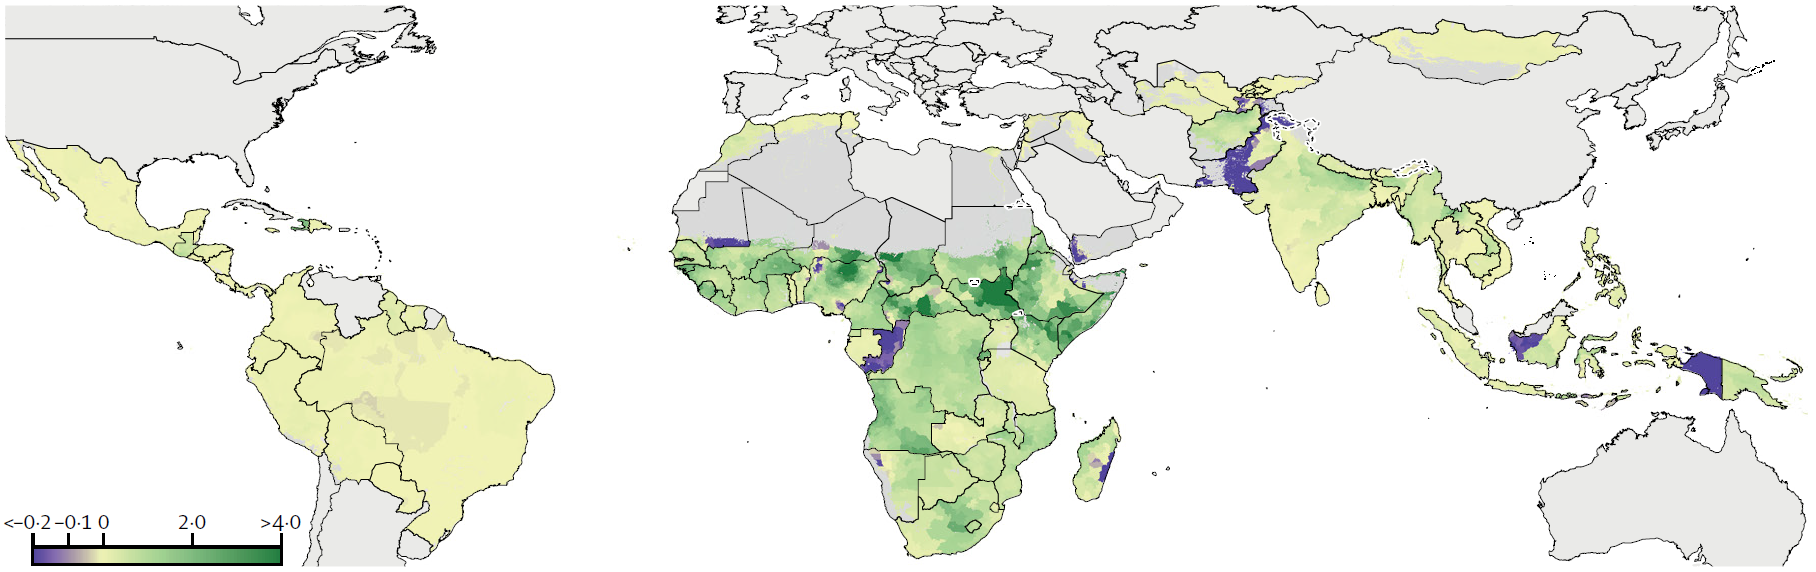
We estimated that almost 300,000 deaths were averted in 2017 due to reduced CGF and improved WASH. The map below shows how these reductions were distributed. The green scale shows the number of averted deaths per 1000 children, while the purple scale shows areas that experienced increases rather than reductions in risk factors.
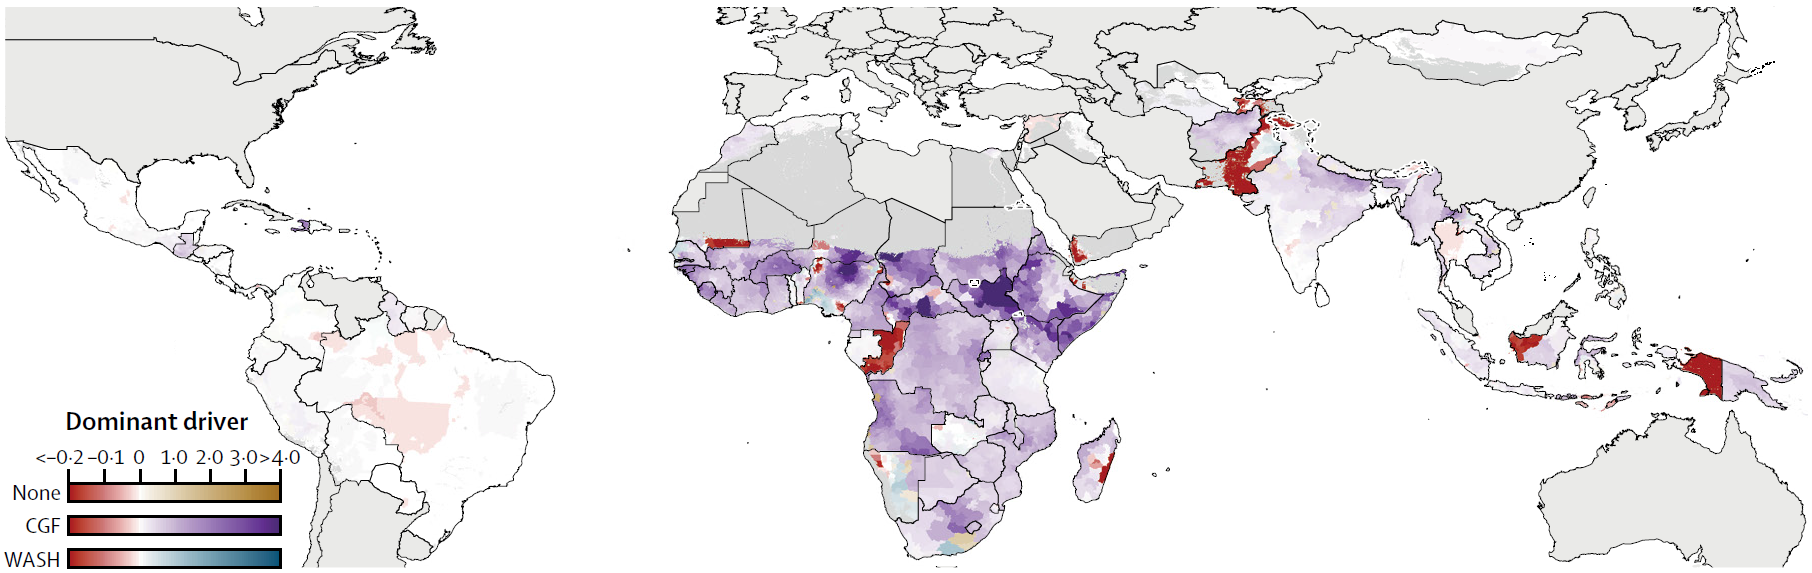
We also broke these results down further to estimate which risk factor contributed most to reductions in diarrhea mortality rates. The map below shows that reductions in child growth failure (indicated by the purple scale) were responsible for most of the lives saved across all countries, but there were also variations within countries. For example, there were subnational areas in Angola and Pakistan where improvements in WASH (indicated by the blue scale) appear to have contributed most to the reductions in mortality.
These maps identify geographic areas where diarrhea burden remains high and many children die each year from diarrhea. Most of these deaths are preventable through treatment and/or by reducing risk factors, and although our estimates suggest progress, a lot of work remains.
At IHME, it is our goal that these maps provide policymakers with the tools they need to support subnational needs assessments and, ultimately, design interventions that save children’s lives through reducing health disparities.
For many of us, diarrhea is a prosaic concern at most, but for millions of people around the world, it is literally a matter of life and death. Our study indicates that with scale-up of interventions, hundreds of thousands of lives may have been saved in 2017 alone.