May 01, 2020
WASH and its links to nutrition
There is strong evidence linking safe WASH to health and nutrition, though nutrition is only one of many development outcomes from investment in WASH services. USAID has identified four recommendations for WASH programming that are likely to have gre...
Factsheets
Apr 18, 2020
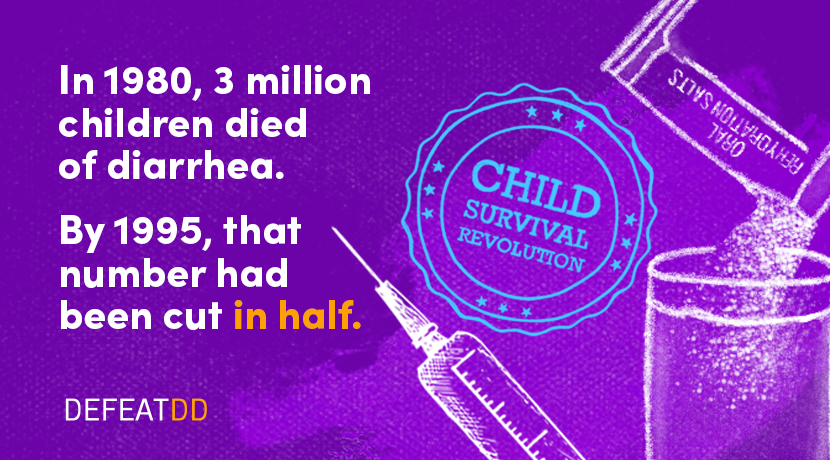
Child survival revolution
In 1980, 14 million young children were dying every year in low-income countries – and diarrheal diseases led the count with three million deaths each year.
Graphics
Feb 05, 2020
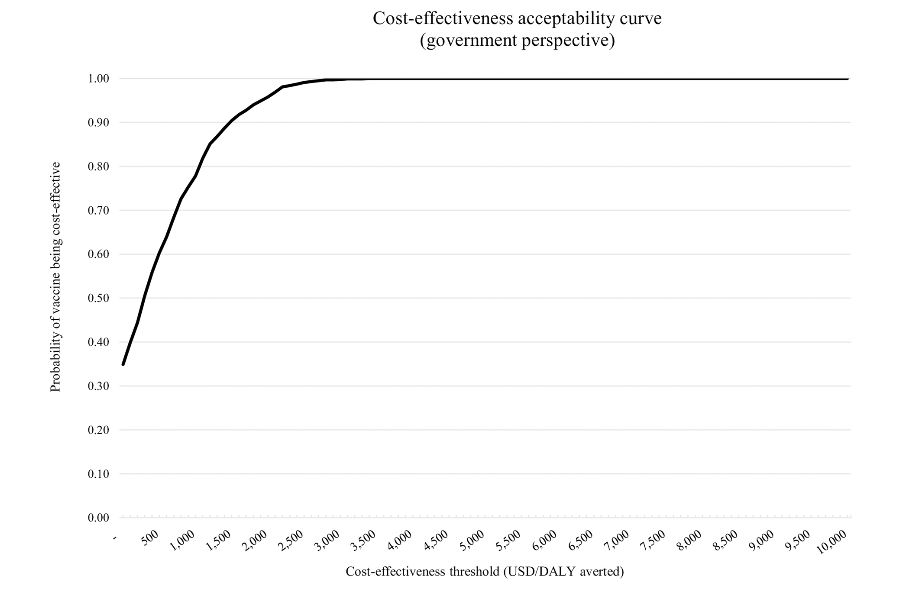
Introduction of rotavirus vaccination in Palestine: An evaluation of the costs, impact, and cost-effectiveness of ROTARIX and ROTAVAC
Rotavirus vaccines are cost-effective. But a new study by PATH and partners helps policymakers decide among the options using important variables beyond price.
Published Research
Jan 16, 2020
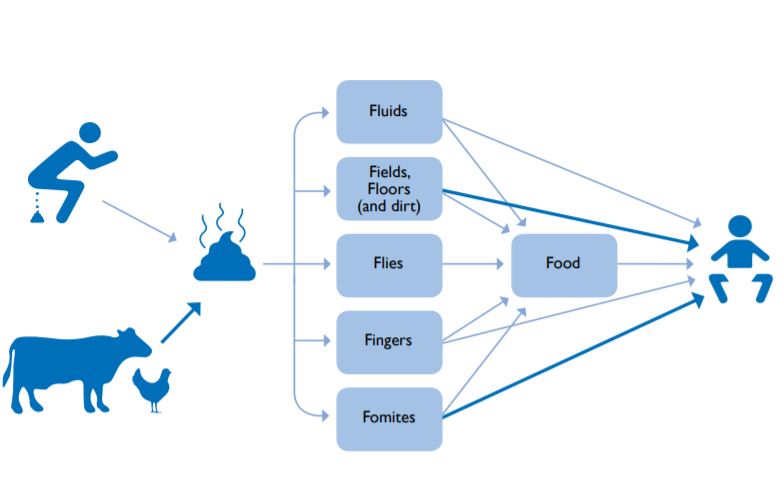
WASH and vaccines: Better together
Vaccines and water, sanitation, and hygiene (WASH) are both necessary to provide communities with comprehensive protection from disease. When both are present, they work even better. Learn more.
Graphics
Dec 23, 2019
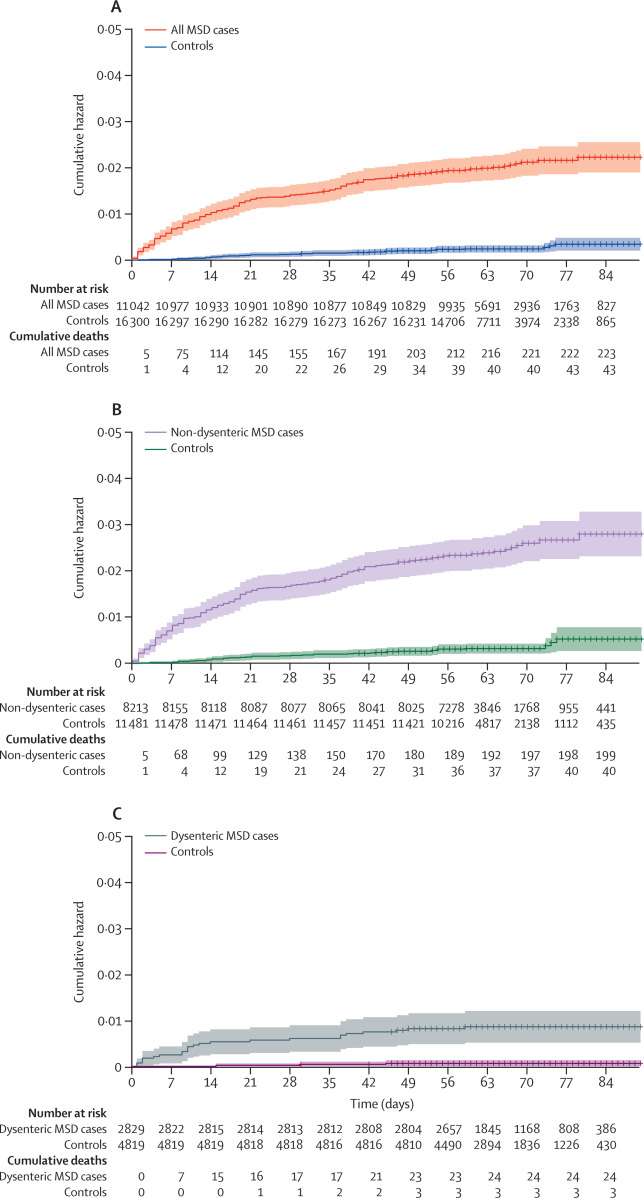
Diarrhoeal disease and subsequent risk of death in infants and children residing in low-income and middle-income countries: analysis of the GEMS case-control study and 12-month GEMS-1A follow-on study
A follow-on analysis of the Global Enteric Multicenter Study (GEMS), published in The Lancet Global Health, finds that the risk of death is increased following moderate-to-severe diarrhea and, to a lesser extent, less-severe diarrhea.
Published Research
Dec 04, 2019
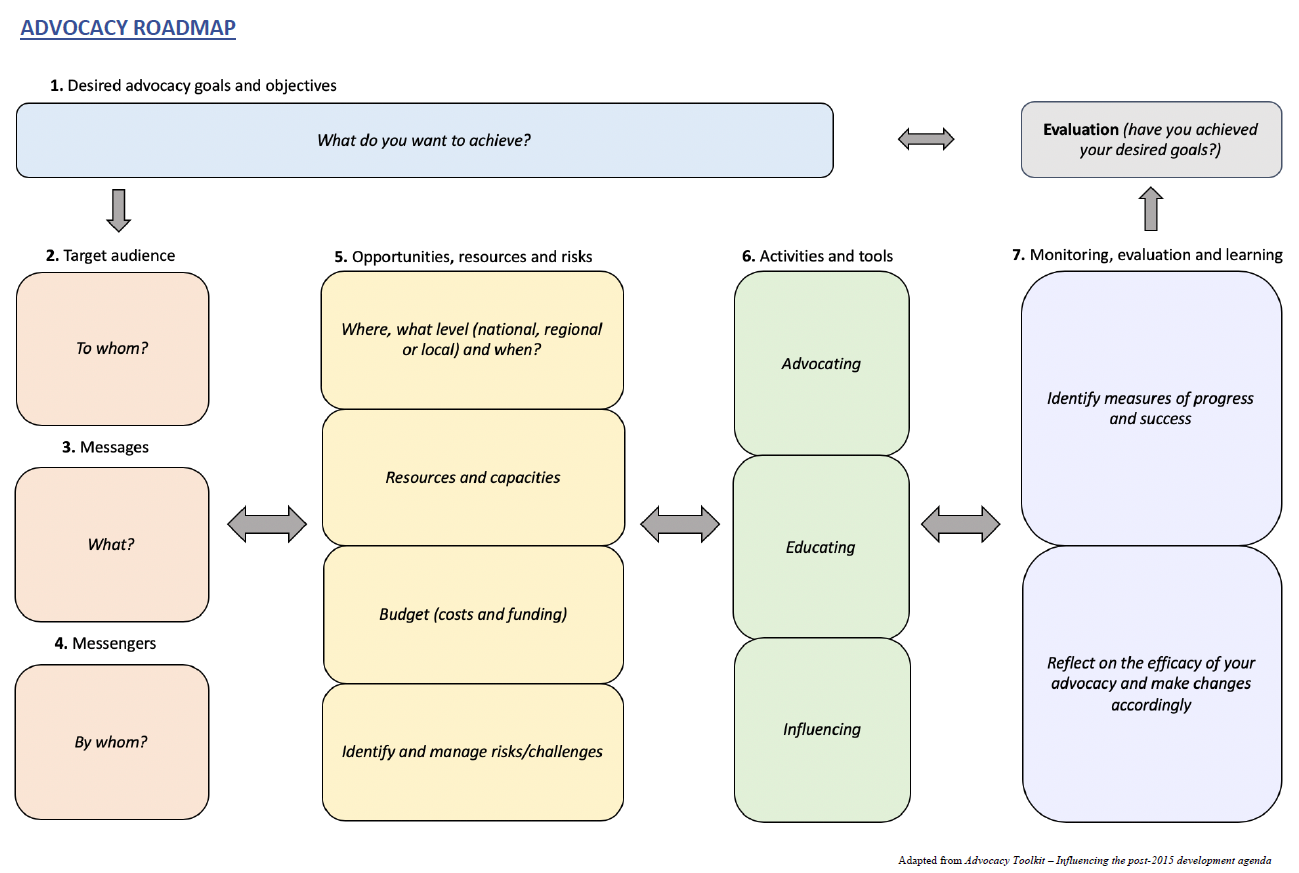
WASH in Healthcare Facilities Advocacy Toolkit
This toolkit from the WASH in Health Care Facilities initiative, led by the World Health Organization and UNICEF, walks through the steps to develop an advocacy strategy for improving water, sanitation, and hygiene (WASH) in health care facilities....
Toolkits
Nov 16, 2019
A Universal Health RevoLOOtion
We’re calling on sanitation and UHC advocates to join forces at the global, national, and local level. Our message is that health for all is impossible without sanitation for all. We need a universal health revo-LOO-tion.
Nov 13, 2019
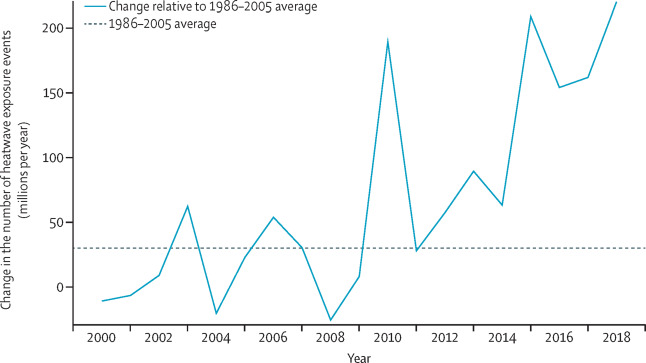
The 2019 report of The Lancet Countdown on health and climate change: ensuring that the health of a child born today is not defined by a changing climate
Children in poor regions will be most affected by climate change-induced diarrheal diseases, via mechanisms such as flooding and the subsequent waterborne illnesses it causes; drought, which reduces availability of nutritious food and can affect h...
Published Research
Oct 30, 2019
Quantifying risks and interventions that have affected the burden of diarrhoea among children younger than 5 years: an analysis of the Global Burden of Disease Study 2017
This paper in The Lancet takes a deep dive to quantify trends and effects of risk factors, interventions, and broader socio-demographic development on diarrhea mortality changes in 195 countries and territories from 1990 to 2017.
Read the full ar...
Published Research
Sep 27, 2019
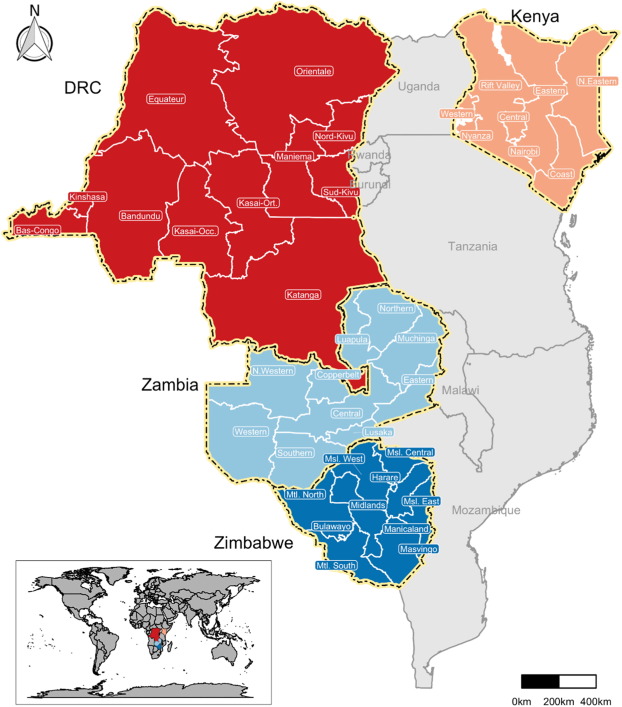
Heterogeneity in Potential Impact and Cost-effectiveness of ETEC and Shigella Vaccination in Four Sub-Saharan African Countries
This analysis shows that the impact and cost-effectiveness of ETEC and Shigella vaccines are more favorable if vaccinations reach the most vulnerable children in underserved provinces. Read the full article.
Published Research