Precision mapping can help save lives from diarrhea

At four-to-five years old, a child is developing creativity, independence, and self-control, according to the Centers for Disease Control and Prevention (CDC). They may be able to tell simple stories and count more than 10 objects.
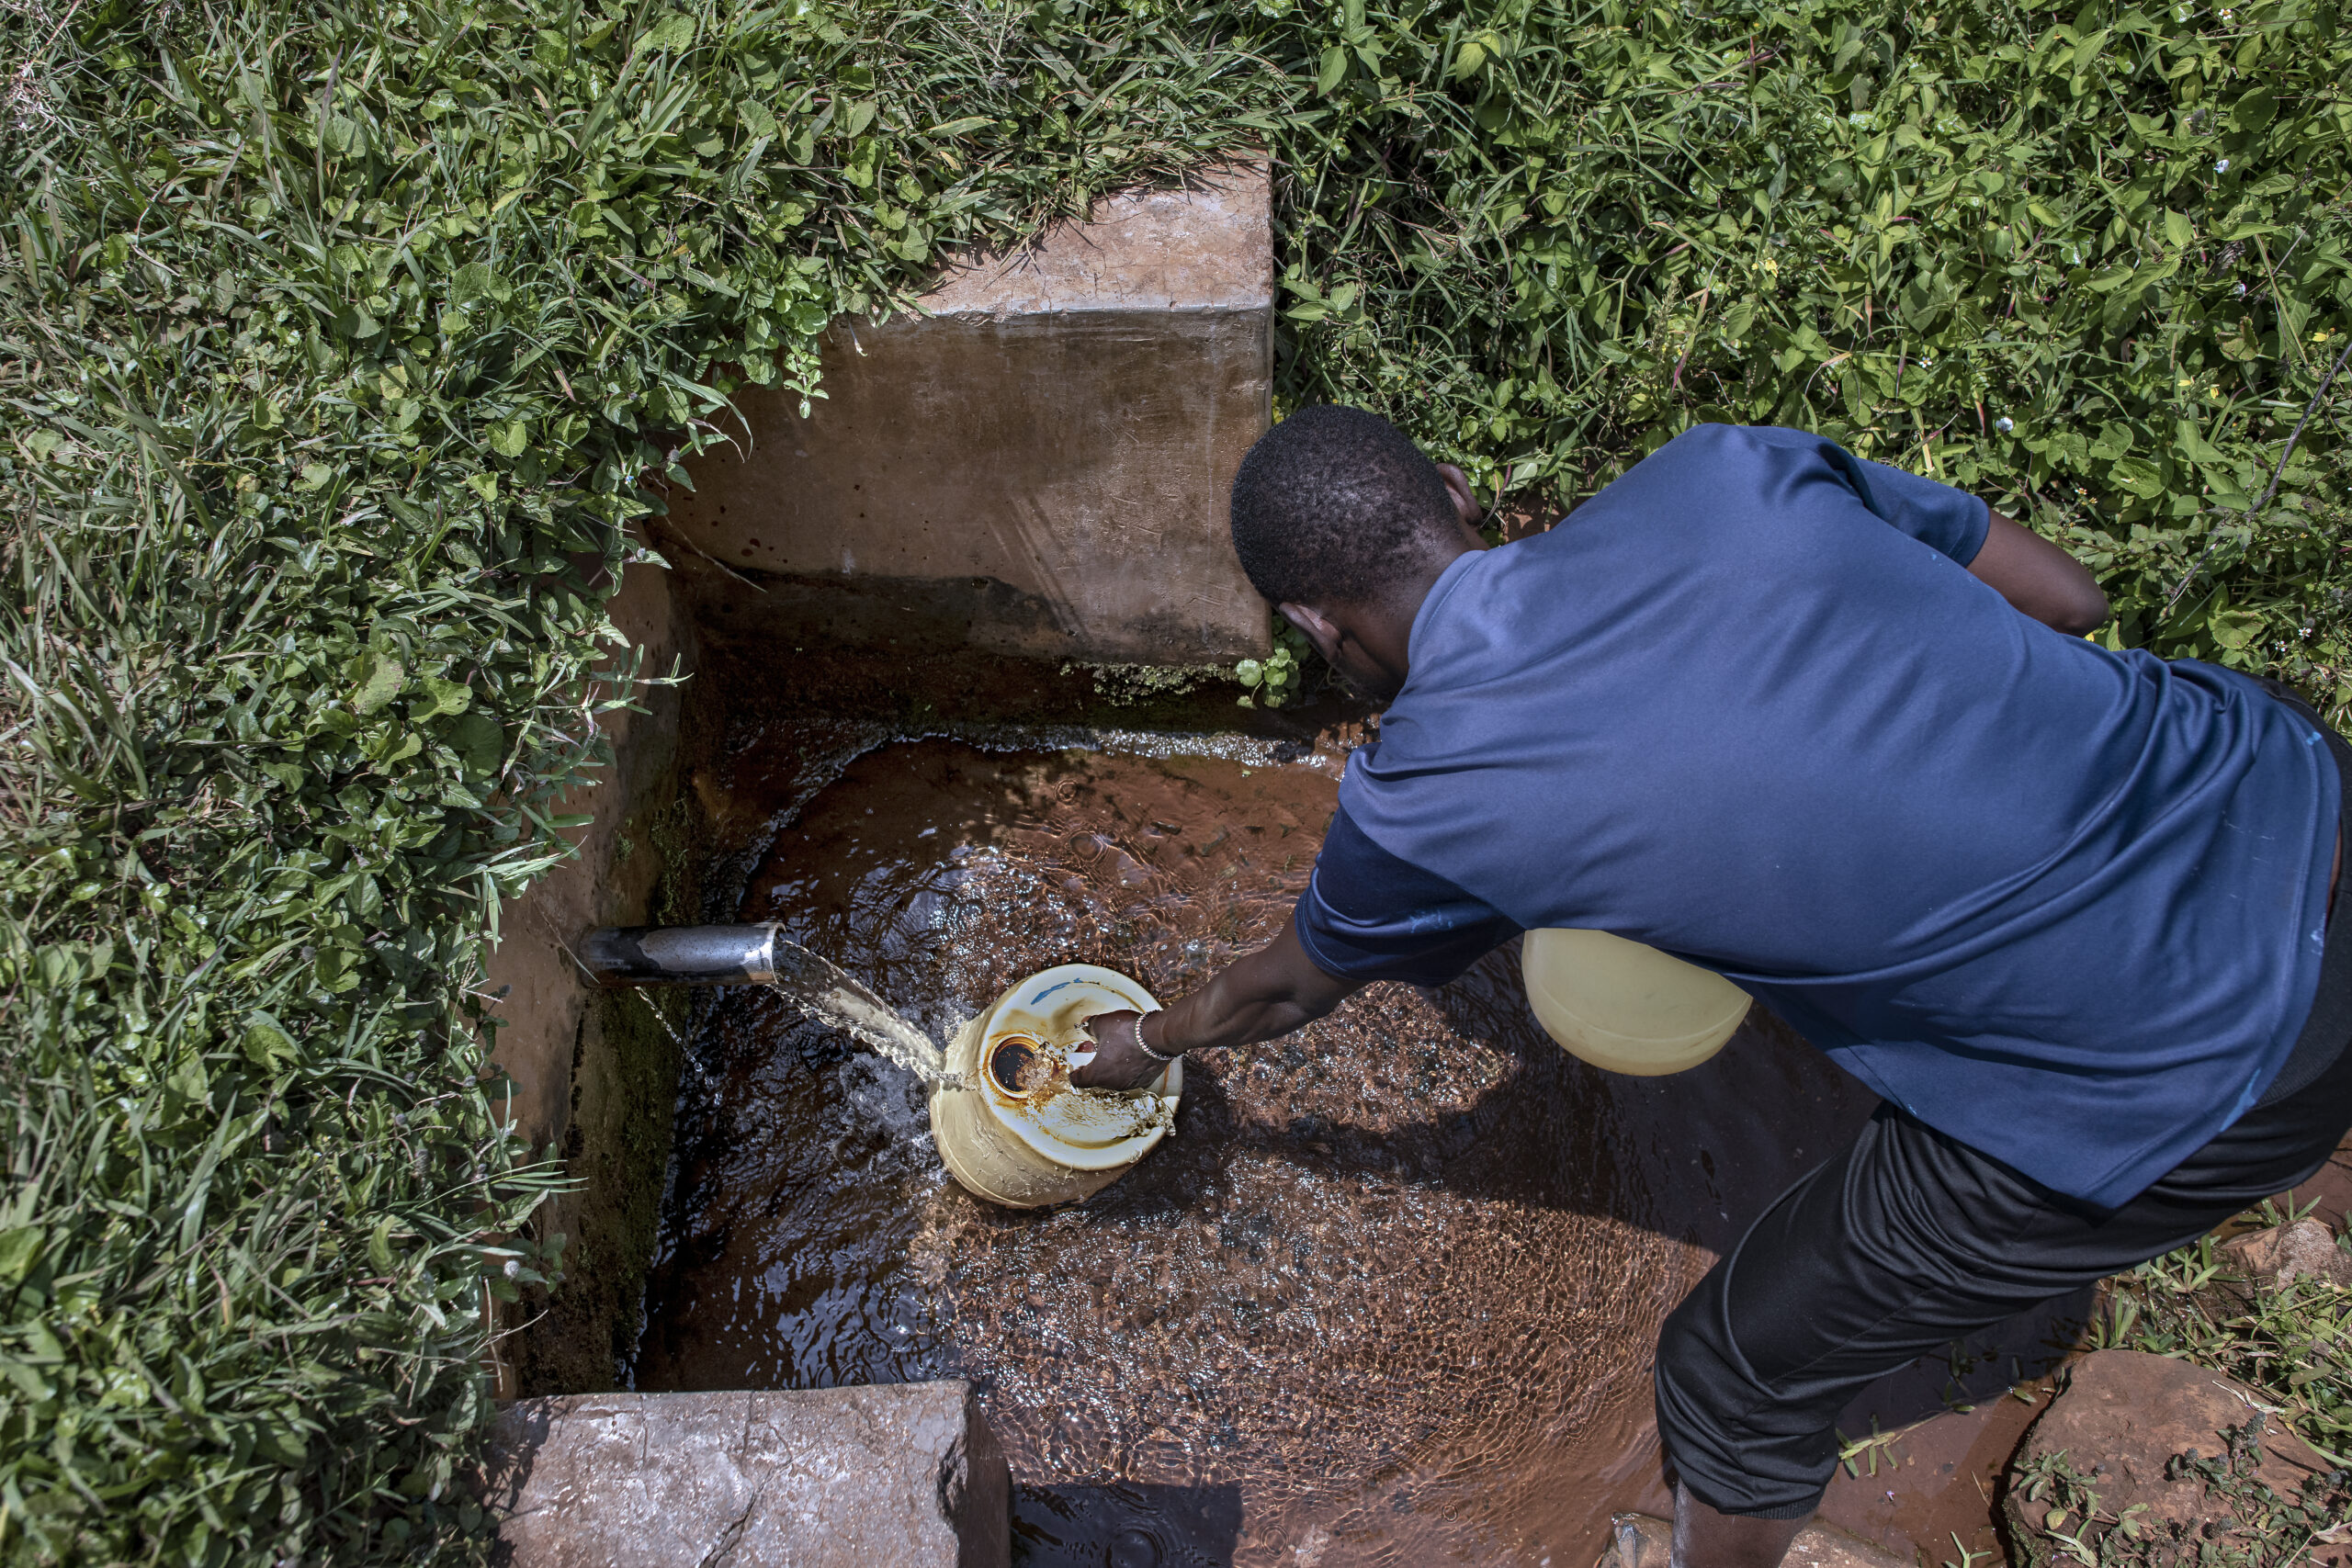
But many children never reach those milestones. Half a million children under the age of five died around the world in 2015 from diarrheal diseases. That staggering number is magnified by the fact that many of those deaths were preventable. Access to safe water, sanitation, and basic health care have proven successful at preventing and treating severe diarrhea. Rotavirus, a leading cause of death from diarrhea, has an effective vaccine.
The United Nations Sustainable Development Goals set a target of eliminating preventable deaths of newborns and children under five by 2030. If current trends continue, more than 50 countries will fall short of that goal.
One way nations can help reach that benchmark is by using precise data to direct health care resources where they are most needed. Our team at the Institute for Health Metrics and Evaluation at the University of Washington is providing data that support precise interventions – commonly referred to as “precision public health.” As part of the Local Burden of Disease project, researchers led by Dr. Bobby Reiner, Assistant Professor of Health Metrics Sciences at IHME, are mapping deaths from diarrheal disease in fine detail, down to 5×5-kilometer squares, to illuminate trends and patterns at a local level.
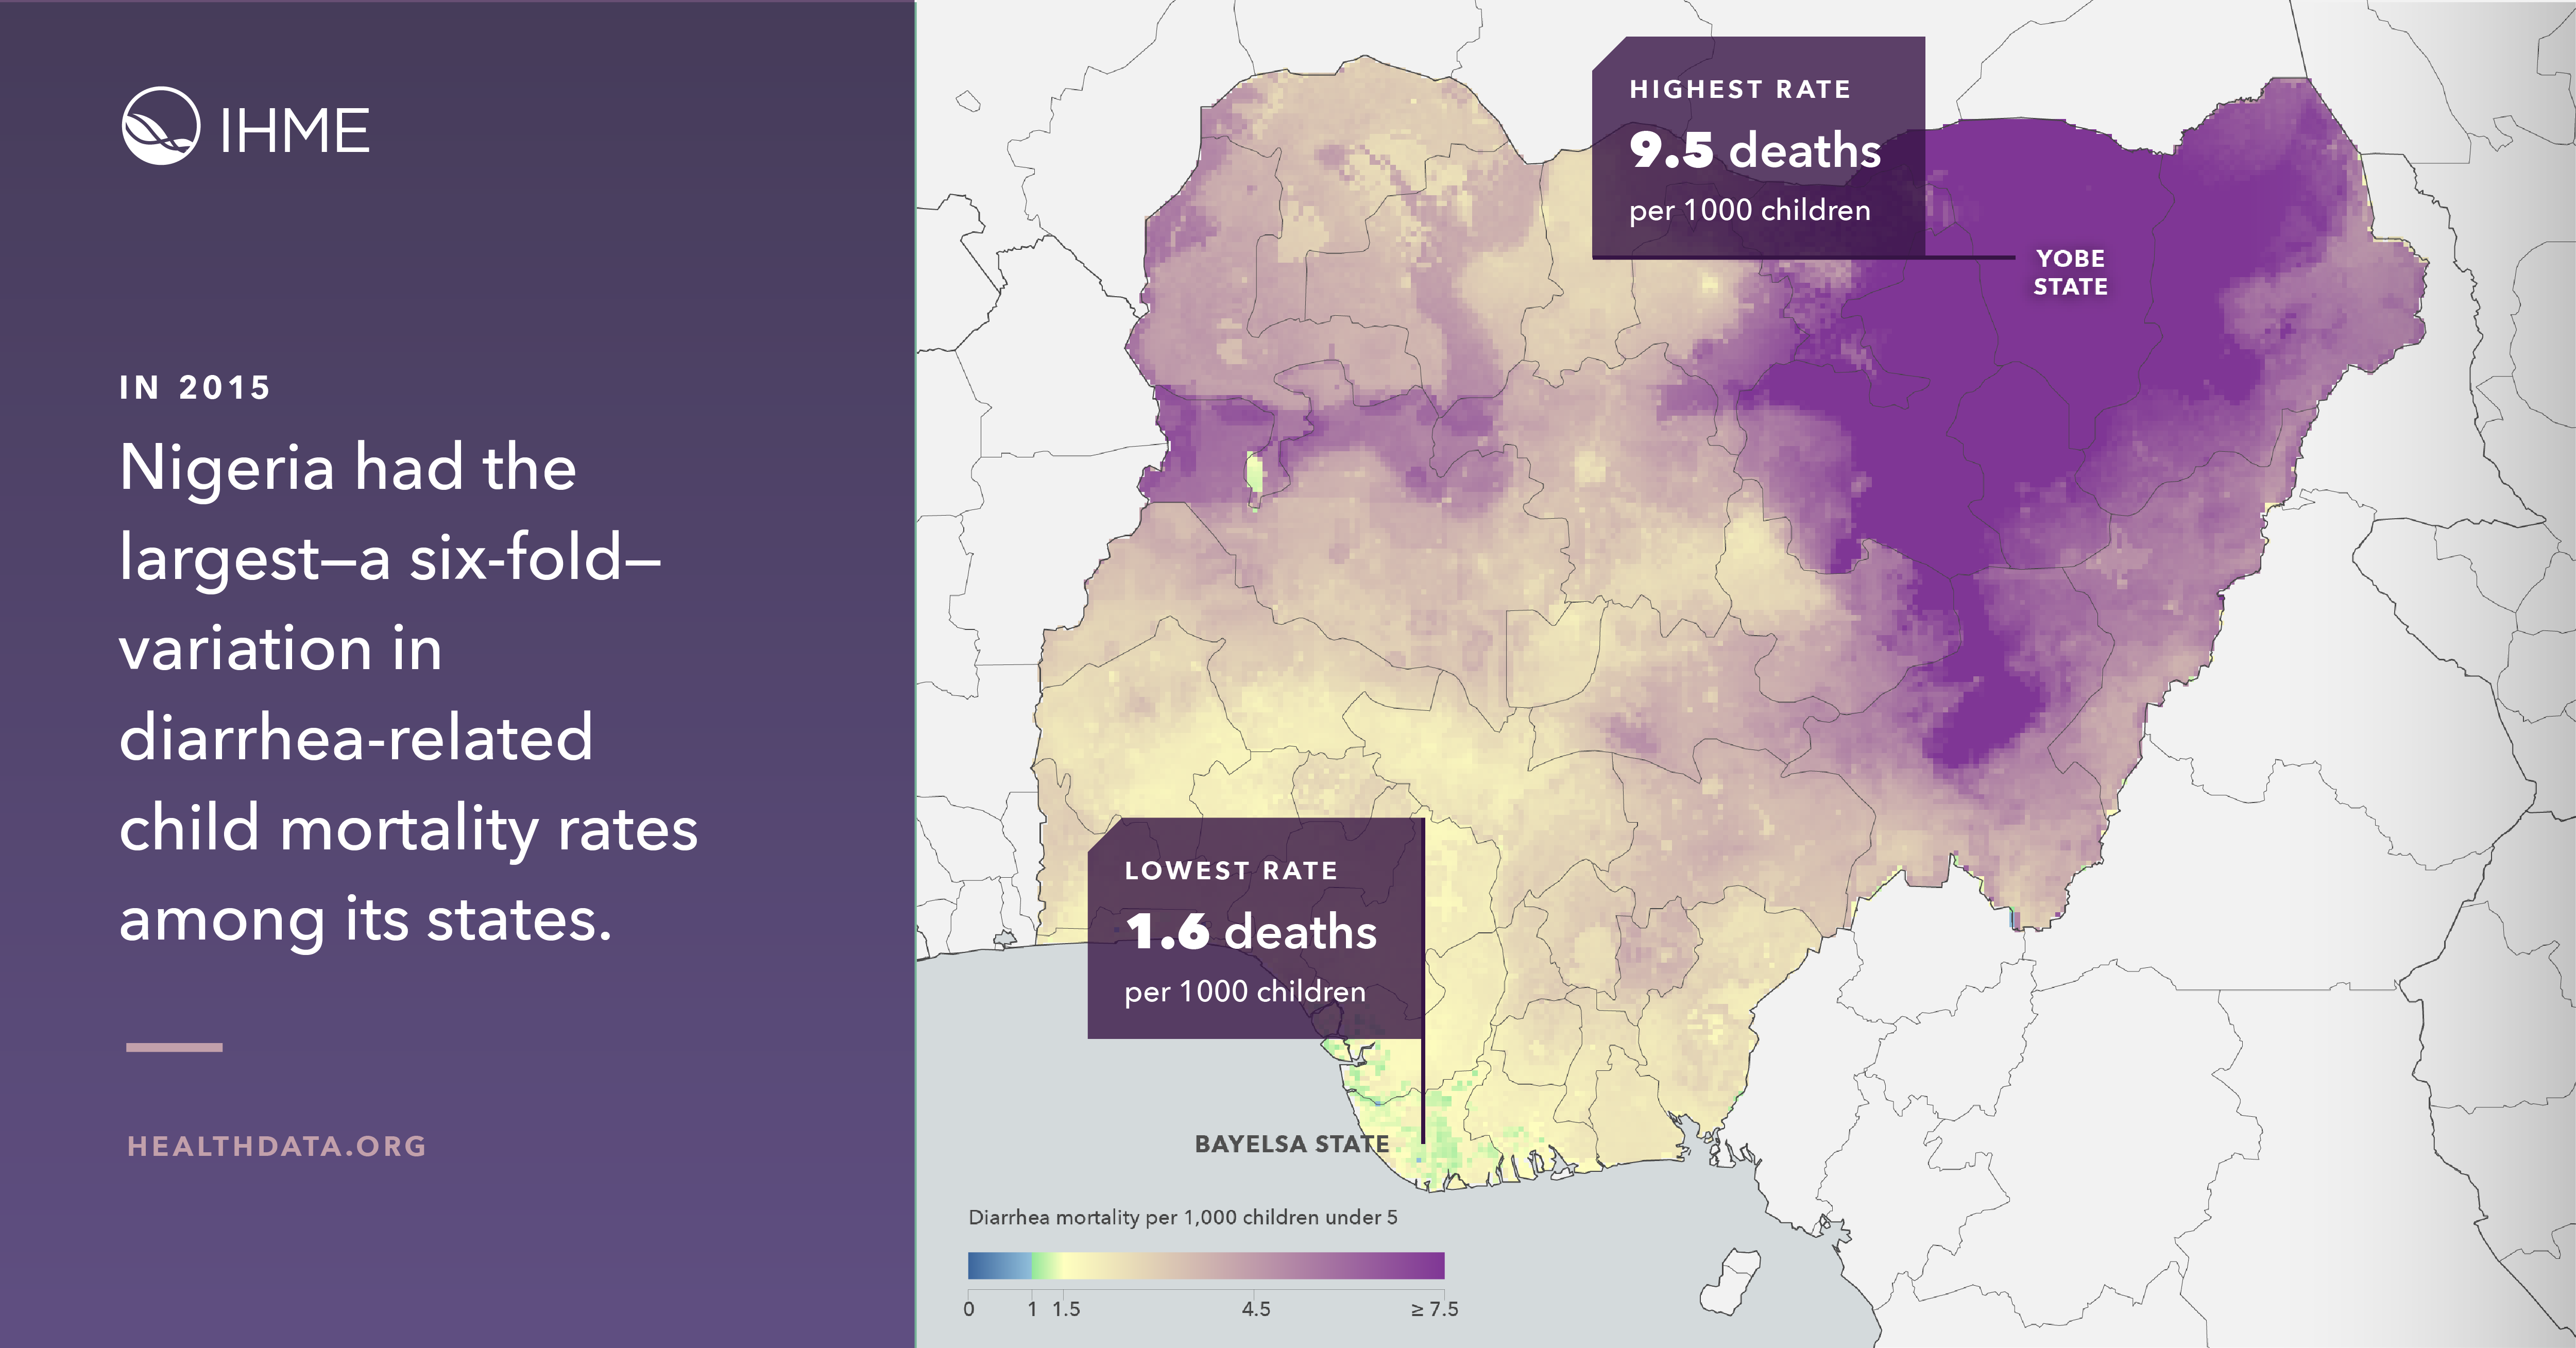
The incredible variation shown by careful mapping demonstrates the value of data in fighting disease. For example, in Nigeria, the regional and district-level data show a more than six-fold difference in areas of highest and lowest mortality, with estimates ranging from 1.6 deaths per 1,000 children in Bayelsa state in the southwest to 9.5 deaths per 1,000 in Yobe state in the northeast. For policymakers and health care workers, knowing the areas of highest risk can enable more focused efforts to save lives.
The maps show hot spots that can be masked by national-level estimates. Despite mortality reductions across nearly all locations in Africa over the 15-year study period, there were areas where deaths increased at the local level. More than half of deaths took place in areas that represent only 35% of the population at risk. Surrounding these areas of concentrated mortality are many regions that have shown steady improvement.
In addition to targeting interventions, precise data can reveal where interventions are succeeding. In Ethiopia, the case fatality rate — the percentage of people with diarrheal disease who died — declined by over 60% between 2000 and 2015. Examining the reasons for that success could highlight strategies worth amplifying in other countries and regions.
The data reveal what could be achieved, offering reason to hope and to act. Estimates show that over 100,000 deaths could have been averted across the continent if countries with the highest case fatality rates had been able to shift to a median case fatality rate. Nigeria alone would have benefitted more than half of those averted deaths. The maps help identify the most vulnerable populations, and it’s critical now to use this important information to support needed change.
The initial focus for LBD mapping work is on sub-Saharan Africa, but later this year, maps will be available for all low- and middle-income countries. The team is also mapping coverage of oral rehydration therapy, access to improved water and sanitation, and the prevalence of exclusive breastfeeding – all elements that can reduce mortality from diarrhea.
Diarrheal disease robs children of their futures. The impact is devastating. Better data means we can do more to stop it, and help thousands more children each year live long, healthy lives.


